User Functions
User functions from DigitalCellSorter.core.DigitalCellSorter class.
Note
All of the tools listed below in this section are intended to use from an
instance of a DigitalCellSorter class. For example:
DCS = DigitalCellSorter.DigitalCellSorter()

DCS.dataName = 'my_data_name'
DCS.saveDir = os.path.join(os.path.dirname(__file__), 'output', DCS.dataName, '')

data = DCS.prepare(raw_data)

DCS.process(DCS.prepare(data))

DCS.makeIndividualGeneExpressionPlot('CCL5')

DCS.makeIndividualGeneTtestPlot('CCL5', analyzeBy='celltype')

cells = DCS.getCells(celltype='T cell')
DCS.makeAnomalyScoresPlot(cells)

# ...
Direct use of function from where they are stored may result in undefined behavior.
Description of the package functionality
The main class of DigitalCellSorter. The class includes tools for:
Pre-preprocessing of single cell RNA sequencing data
Quality control
Batch effects correction
Cells anomaly score evaluation
Dimensionality reduction
Clustering
Annotation of cell types
Vizualization
Post-processing
Primary tools
Primary tools are used for pre-processing of the input data, quality control, batch correction, dimensionality reduction, clustering and cell type annotation.
Note
We reccomend to use only functions prepare(), process(), and
visualize() of the Primary tools. All processing workflow is contained
within process().
If you wish to modify the workflow use the other components of the
Primary tools, such as cluster(), project() etc.
References to DigitalCellSorter class:
|
Prepare pandas.DataFrame for input to function process() If input is pd.DataFrame validate the input whether it has correct structure. |
|
Convert index to hugo names, if any names in the index are duplicated, remove duplicates |
|
Clean pandas.DataFrame: validate index, remove index duplicates, replace missing with zeros, remove all-zero rows and columns |
|
Project pandas.DataFrame to lower dimensions |
|
Cluster PCA-reduced data into a desired number of clusters |
|
Produce cluster voting results, annotate cell types, and update marker expression with cell type labels |
|
Process data before using any annotation of visualization functions |
Aggregate of visualization tools of this class. |
Function prepare(): prepare input data for function process()
-
DigitalCellSorter.prepare(obj)[source] Prepare pandas.DataFrame for input to function process() If input is pd.DataFrame validate the input whether it has correct structure.
- Parameters:
- obj: str, pandas.DataFrame, pandas.Series
Expression data in a form of pandas.DataFrame, pandas.Series, or name and path to a csv file with data
- Returns:
None
- Usage:
DCS = DigitalCellSorter.DigitalCellSorter()
dDCS.preapre(‘data.csv’)
Function convert(): convert gene index of a DataFrame prepared by function prepare()
from one naming convention to another
-
DigitalCellSorter.convert(nameFrom=None, nameTo=None, **kwargs)[source] Convert index to hugo names, if any names in the index are duplicated, remove duplicates
- Parameters:
- nameFrom: str, Default ‘alias’
Gene name type to convert from
- nameTo: str, Default ‘hugo’
Gene name type to convert to
Any parameters that function ‘mergeIndexDuplicates’ can accept
- Returns:
None
- Usage:
DCS = DigitalCellSorter.DigitalCellSorter()
DCS.convertIndex()
Function clean(): validate index, replace missing with zeros,
remove all-zero rows and columns of a DataFrame
-
DigitalCellSorter.clean()[source] Clean pandas.DataFrame: validate index, remove index duplicates, replace missing with zeros, remove all-zero rows and columns
- Parameters:
None
- Returns:
None
- Usage:
DCS = DigitalCellSorter.DigitalCellSorter()
DCS.clean()
Function normalize(): rescale all cells, log-transform data,
remove constant genes, and sort index of a DataFrame
-
DigitalCellSorter.normalize(median=None)[source] Normalize pandas.DataFrame: rescale all cells, log-transform data, remove constant genes, sort index
- Parameters:
- median: float, Default None
Scale factor, if not provided will be computed as median across all cells in data
- Returns:
None
- Usage:
DCS = DigitalCellSorter.DigitalCellSorter()
DCS.normalize()
Function project(): project data to lower dimensions
-
DigitalCellSorter.project(PCAonly=False, do_fast_tsne=True)[source] Project pandas.DataFrame to lower dimensions
- Parameters:
- PCAonly: boolean, Default False
Perform Principal component analysis only
- do_fast_tsne: boolean, Default True
Do FI-tSNE instead of “exact” tSNE This option is ignored if layout is not ‘TSNE’
- Returns:
- tuple
Processed data
- Usage:
DCS = DigitalCellSorter.DigitalCellSorter()
xPCA, PCs, tSNE = DCS.project()
Function cluster(): cluster PCA-reduced data into a desired number of clusters
-
DigitalCellSorter.cluster()[source] Cluster PCA-reduced data into a desired number of clusters
- Parameters:
None
- Returns:
None
- Usage:
DCS = DigitalCellSorter.DigitalCellSorter()
DCS.cluster()
Function annotate(): produce cluster voting results
-
DigitalCellSorter.annotate(mapNonexpressedCelltypes=True)[source] Produce cluster voting results, annotate cell types, and update marker expression with cell type labels
- Parameters:
- mapNonexpressedCelltypes: boolean, Default True
If True then cell types coloring will be consistent across all datasets, regardless what cell types are annotated in all datasets for a given input marker list file.
- Returns:
- dictionary
Voting results, a dictionary in form of: {cluster label: assigned cell type}
- Usage:
DCS = DigitalCellSorter.DigitalCellSorter()
results = DCS.annotate(df_markers_expr, df_marker_cell_type)
Function process(): main function
-
DigitalCellSorter.process(dataIsNormalized=False, cleanData=True)[source] Process data before using any annotation of visualization functions
- Parameters:
- dataIsNormalized: boolean, Default False
Whether DCS.df_expr is normalized or not
- Returns:
None
- Usage:
DCS = DigitalCellSorter.DigitalCellSorter()
DCS.process()
Function visualize(): make all default plots of to visualize results
of function process()
-
DigitalCellSorter.visualize()[source] Aggregate of visualization tools of this class.
- Parameters:
None
- Returns:
None
- Usage:
DCS = DigitalCellSorter.DigitalCellSorter()
DCS.process()
DCS.visualize()
Extraction tools
Warning
Use these functions only after process()
References to DigitalCellSorter class:
|
Get expression of a gene. |
|
Get expression of a set of cells. |
|
Get cell annotations in a form of pandas.Series |
|
Function to get anomaly score of cells based on some reference set |
|
Extract new marker genes based on the cluster annotations |
|
Get index of sells that satisfy the QC criteria |
|
Get a pandas.DataFrame with cross-counts (overlaps) between two pandas.Series |
Function getExprOfGene(): Get expression of a gene
-
DigitalCellSorter.getExprOfGene(gene, analyzeBy='cluster')[source] Get expression of a gene. Run this function only after function process()
- Parameters:
- cells: pandas.MultiIndex
Index of cells of interest
- analyzeBy: str, Default ‘cluster’
What level of lablels to include. Other possible options are ‘label’ and ‘celltype’
- Returns:
- pandas.DataFrame
With expression of the cells of interest
- Usage:
DCS = DigitalCellSorter.DigitalCellSorter()
DCS.process()
DCS.getExprOfGene(‘SDC1’)
Function getExprOfCells(): Get expression of a set of cells
-
DigitalCellSorter.getExprOfCells(cells)[source] Get expression of a set of cells. Run this function only after function process()
- Parameters:
- cells: pandas.MultiIndex
2-level Index of cells of interest, must include levels ‘batch’ and ‘cell’
- Returns:
- pandas.DataFrame
With expression of the cells of interest
- Usage:
DCS = DigitalCellSorter.DigitalCellSorter()
DCS.process()
DCS.getExprOfCells(cells)
Function getCells(): get cells index by celltype, clusterIndex or clusterName
-
DigitalCellSorter.getCells(celltype=None, clusterIndex=None, clusterName=None)[source] Get cell annotations in a form of pandas.Series
- Parameters:
- celltype: str, Default None
Cell type to extract
- clusterIndex: int, Default None
Cell type to extract
- clusterName: str, Default None
Cell type to extract
- Returns:
- pandas.MultiIndex
Index of labelled cells
- Usage:
DCS = DigitalCellSorter.DigitalCellSorter()
DCS.process()
labels = DCS.getCells()
Function getAnomalyScores(): get anomaly score of cells based on some reference set
-
DigitalCellSorter.getAnomalyScores(trainingSet, testingSet, printResults=False)[source] Function to get anomaly score of cells based on some reference set
- Parameters:
- trainingSet: pandas.DataFrame
With cells to trail isolation forest on
- testingSet: pandas.DataFrame
With cells to score
- printResults: boolean, Default False
Whether to print results
- Returns:
- 1d numpy.array
Anomaly score(s) of tested cell(s)
- Usage:
DCS = DigitalCellSorter.DigitalCellSorter()
cutoff = DCS.getAnomalyScores(df_expr.iloc[:, 5:], df_expr.iloc[:, :5])
Function getNewMarkerGenes(): extract new markers from the annotated clusters and produce plot of the new markers
-
DigitalCellSorter.getNewMarkerGenes(cluster=None, top=100, zScoreCutoff=None, removeUnknown=False, **kwargs)[source] Extract new marker genes based on the cluster annotations
- Parameters:
- cluster: int, Default None
Cluster #, if provided genes of only this culster will be returned
- top: int, Default 100
Upper bound for number of new markers per cell type
- zScoreCutoff: float, Default 0.3
Lower bound for a marker z-score to be significant
- removeUnknown: boolean, Default False
Whether to remove type “Unknown”
Any parameters that function ‘makePlotOfNewMarkers’ can accept
- Returns:
None
- Usage:
DCS = DigitalCellSorter.DigitalCellSorter()
DCS.extractNewMarkerGenes()
Function getIndexOfGoodQualityCells(): Get index of sells that satisfy the QC criteria
-
DigitalCellSorter.getIndexOfGoodQualityCells(QCplotsSubDir='QC_plots', **kwargs)[source] Get index of sells that satisfy the QC criteria
- Parameters:
- count_depth_cutoff: float, Default 0.5
Fraction of median to take as count depth cutoff
- number_of_genes_cutoff: float, Default 0.5
Fraction of median to take as number of genes cutoff
- mitochondrial_genes_cutoff: float, Default 3.0
The cutoff is median + standard_deviation * this_parameter
Any parameters that function ‘makeQualityControlHistogramPlot’ can accept
- Returns:
- pandas.Index
Index of cells
- Usage:
DCS = DigitalCellSorter.DigitalCellSorter()
index = DCS.getIndexOfGoodQualityCells()
Function getCountsDataframe(): Get a pandas.DataFrame with cross-counts (overlaps) between two pandas.Series
-
DigitalCellSorter.getCountsDataframe(se1, se2, tagForMissing='N/A')[source] Get a pandas.DataFrame with cross-counts (overlaps) between two pandas.Series
- Parameters:
- se1: pandas.Series
Series with the first set of items
- se2: pandas.Series
Series with the second set of items
- tagForMissing: str, Default ‘N/A’
Label to assign to non-overlapping items
- Returns:
- pandas.DataFrame
Contains counts
- Usage:
DCS = DigitalCellSorter.DigitalCellSorter()
df = DCS.getCountsDataframe(se1, se2)
Visualization tools
Warning
Use these functions only after process()
References to DigitalCellSorter class:
|
Produce projection plot colored by cell types |
|
Produce projection plot colored by batches |
|
Produce projection plot colored by clusters |
|
Produce Quality Control projection plots |
|
Produce subplots on each marker and its expression on all clusters |
|
Make anomaly scores plot |
|
Produce individual gene t-test plot of the two-tailed p-value. |
|
Produce individual gene expression plot on a 2D layout |
References to VisualizationFunctions class:
|
Function to calculate QC quality cutoff and visualize it on a histogram |
|
Produce histogram plot of the voting null distributions |
|
Produce voting results voting matrix plot |
|
Produce image on marker genes and their expression on all clusters. |
|
Produce stacked barplot with cell fractions |
|
Make a Sankey diagram, also known as ‘river plot’ with two groups of nodes |
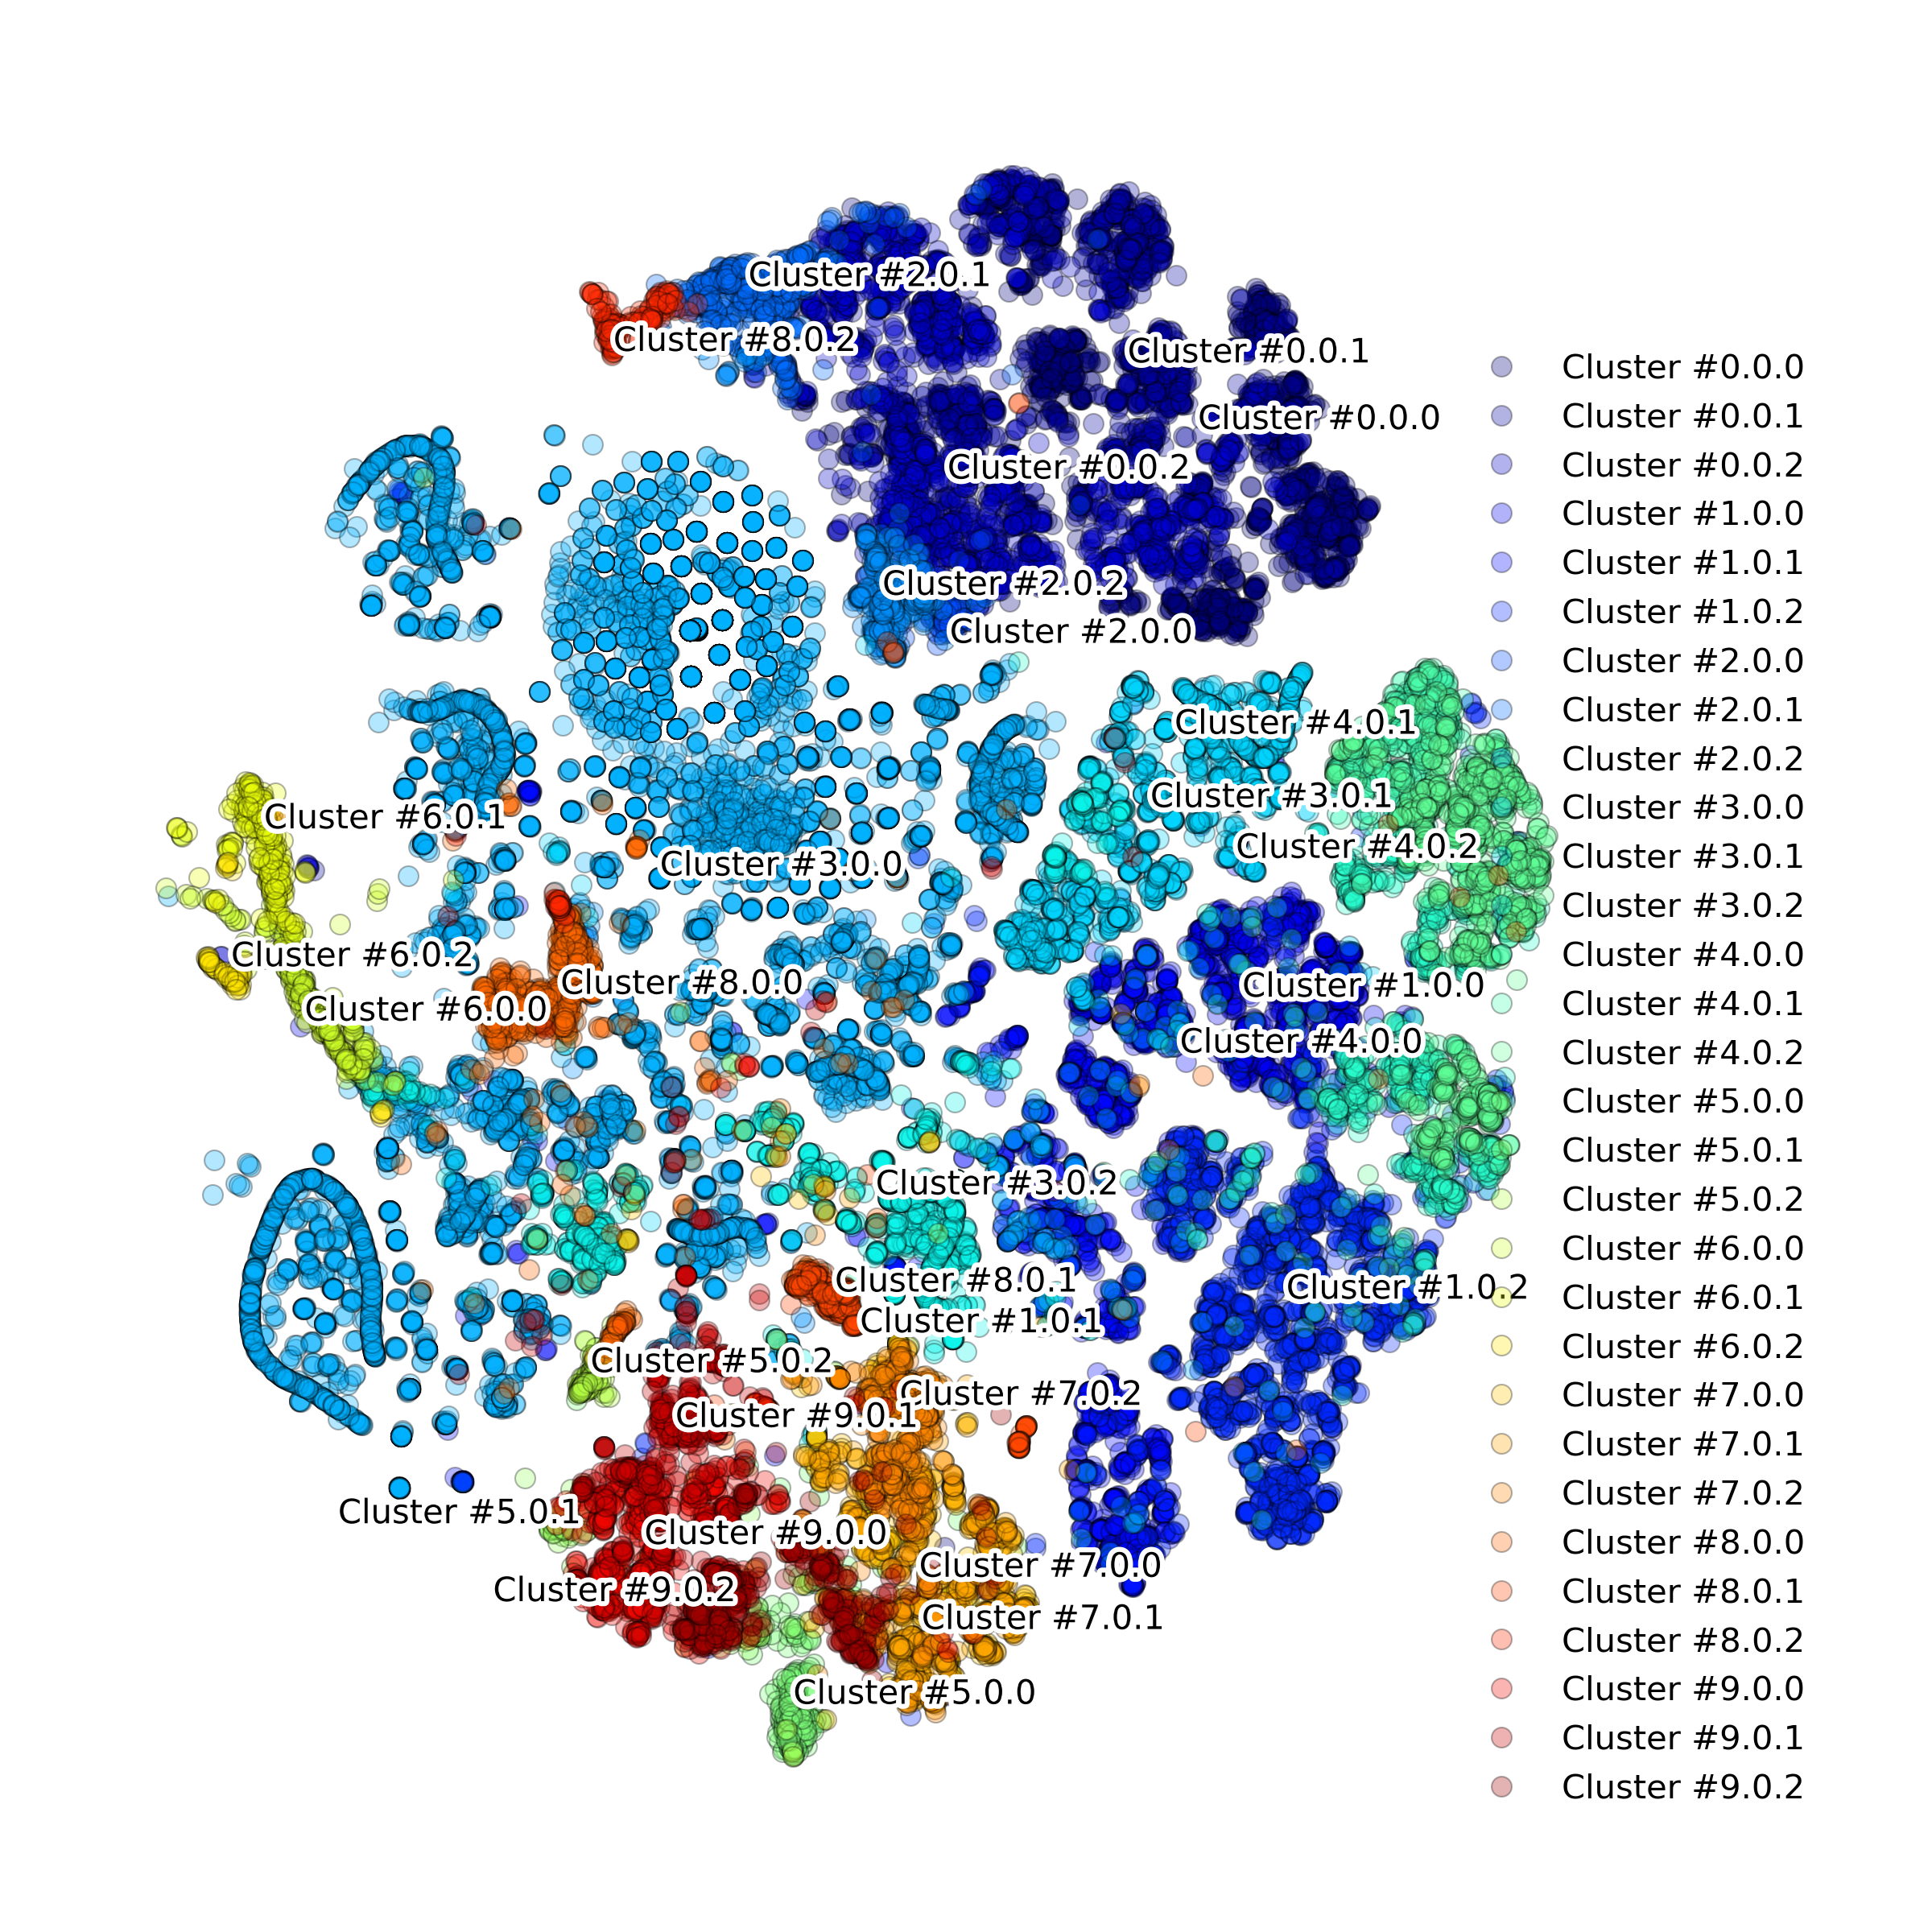
Function makeProjectionPlotAnnotated(): Produce t-SNE plot colored by cell types
-
DigitalCellSorter.makeProjectionPlotAnnotated(**kwargs)[source] Produce projection plot colored by cell types
- Parameters:
Any parameters that function ‘makeProjectionPlot’ can accept
- Returns:
None
- Usage:
DCS = DigitalCellSorter.DigitalCellSorter()
DCS.process()
DCS.makeProjectionPlotAnnotated()
Example output:

Function makeProjectionPlotByBatches(): Produce t-SNE plot colored by batches
-
DigitalCellSorter.makeProjectionPlotByBatches(**kwargs)[source] Produce projection plot colored by batches
- Parameters:
Any parameters that function ‘makeProjectionPlot’ can accept
- Returns:
None
- Usage:
DCS = DigitalCellSorter.DigitalCellSorter()
DCS.process()
DCS.makeProjectionPlotByBatches()
Example output:

Function makeProjectionPlotByClusters(): Produce t-SNE plot colored by clusters
-
DigitalCellSorter.makeProjectionPlotByClusters(**kwargs)[source] Produce projection plot colored by clusters
- Parameters:
Any parameters that function ‘makeProjectionPlot’ can accept
- Returns:
None
- Usage:
DCS = DigitalCellSorter.DigitalCellSorter()
DCS.process()
DCS.makeProjectionPlotByClusters()
Example output:
Function makeQualityControlHistogramPlot(): Produce Quality Control histogram plots
-
DigitalCellSorter.makeQualityControlHistogramPlot(*args, **kwargs) Function to calculate QC quality cutoff and visualize it on a histogram
- Parameters:
- subset: pandas.Series
Data to analyze
- cutoff: float
Cutoff to display
- plotPathAndName: str, Default None
Text to include in the figure title and file name
- N_bins: int, Default 100
Number of bins of the histogram
- mito: boolean, Default False
Whether the analysis of mitochondrial genes fraction
- displayMeasures: boolean, Default True
Print vertical dashed lines along with mean, median, and standard deviation
- precision: int, Default 4
Number of digits after decimal
- quantilePlotCutoff: float, Default 0.99
Distributions are cut to display the range from 0 to quantilePlotCutoff
- dpi: int, Default 600
Resolution of the figure image
- extension: str, Default ‘png’
Format of the figure file
- fontScale: float, Default 1.5
Scale most of the figure fonts
- includeTitle: boolean, Default False
Whether to include title on the figure
- Returns:
None
- Usage:
DCS = DigitalCellSorter.DigitalCellSorter()
cutoff = DCS.makeQualityControlHistogramPlot(subset, cutoff)
Example output:


Function makeProjectionPlotsQualityControl(): Produce Quality Control t-SNE plots
-
DigitalCellSorter.makeProjectionPlotsQualityControl(**kwargs)[source] Produce Quality Control projection plots
- Parameters:
Any parameters that function ‘makeProjectionPlot’ can accept
- Returns:
None
- Usage:
DCS = DigitalCellSorter.DigitalCellSorter()
DCS.process()
DCS.makeProjectionPlotsQualityControl()
Example output:


Function makeMarkerSubplots(): Produce subplots on each marker and its expression on all clusters
-
DigitalCellSorter.makeMarkerSubplots(**kwargs)[source] Produce subplots on each marker and its expression on all clusters
- Parameters:
Any parameters that function ‘internalMakeMarkerSubplots’ can accept
- Returns:
None
- Usage:
DCS = DigitalCellSorter.DigitalCellSorter()
DCS.process()
DCS.makeMarkerSubplots()
Example output:
.png?raw=true)
.png?raw=true)
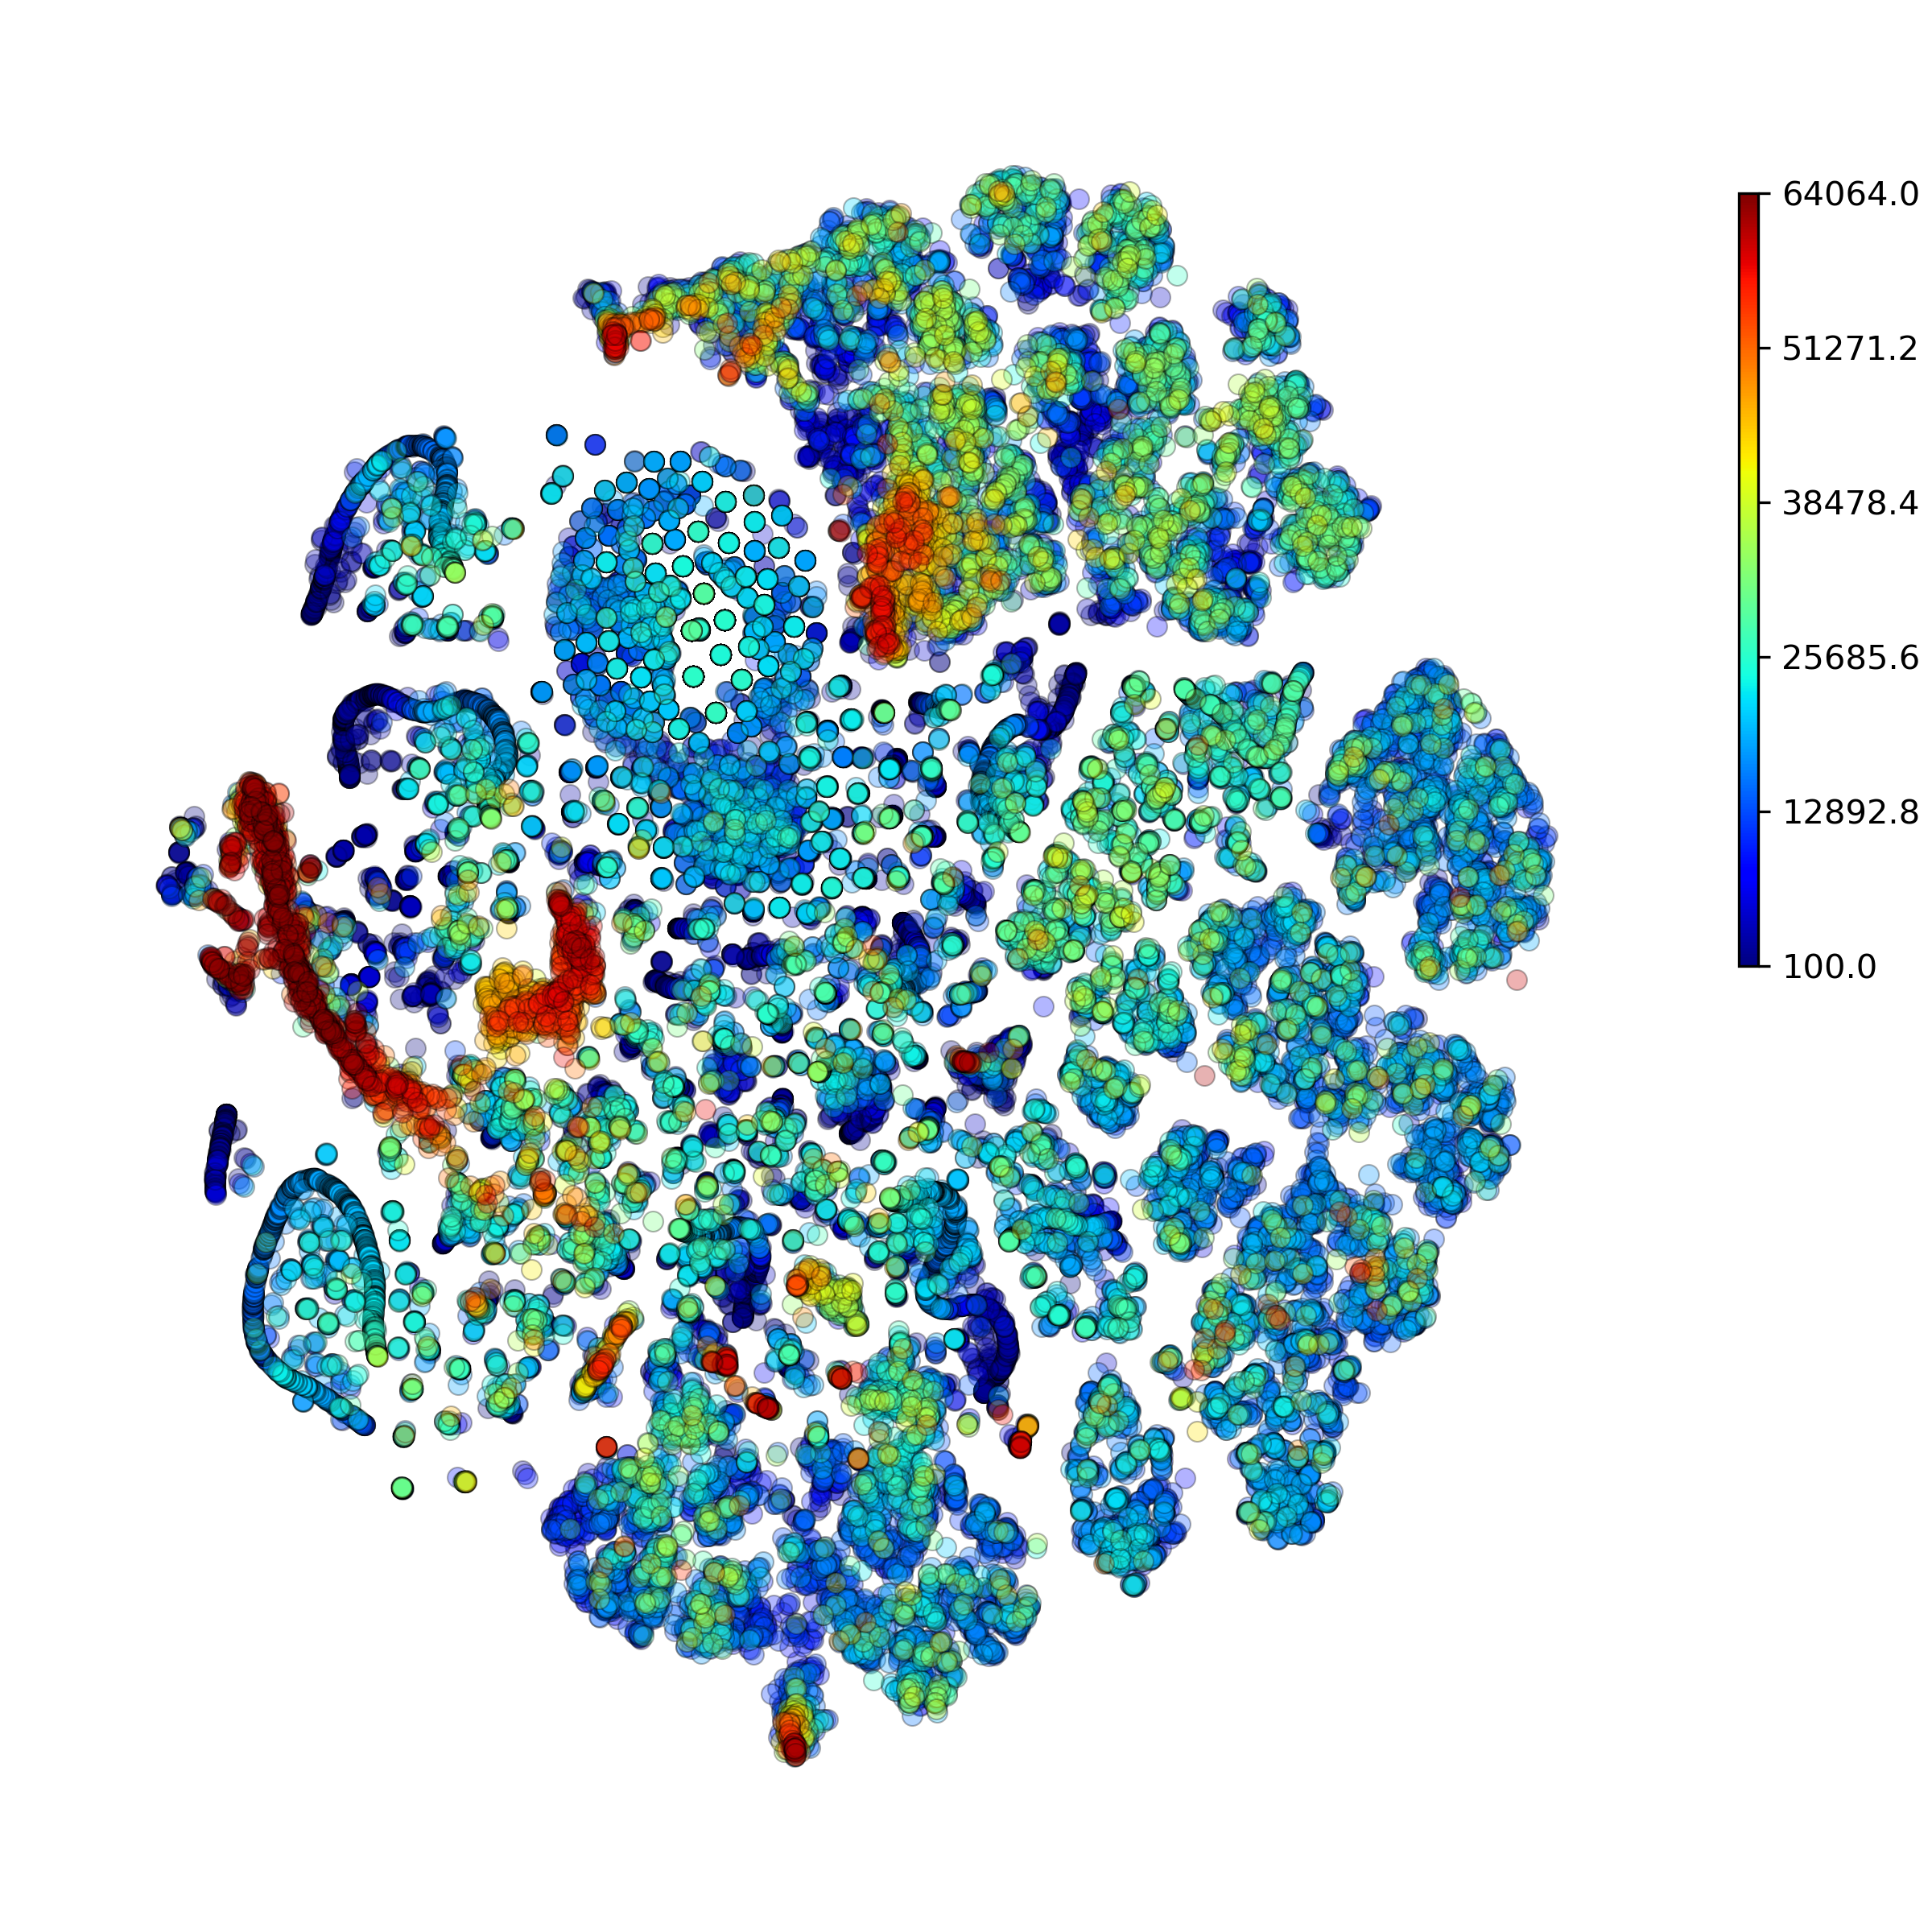
Function makeAnomalyScoresPlot(): Make anomaly scores plot
-
DigitalCellSorter.makeAnomalyScoresPlot(cells='All', suffix='', noPlot=False, **kwargs)[source] Make anomaly scores plot
- Parameters:
- cells: pandas.MultiIndex, Default ‘All’
Index of cells of interest
Any parameters that function ‘makeProjectionPlot’ can accept
- Returns:
None
- Usage:
DCS = DigitalCellSorter.DigitalCellSorter()
DCS.process()
cells = DCS.getCells(celltype=’T cell’)
DCS.makeAnomalyScoresPlot(cells)
Example output:


Function makeIndividualGeneTtestPlot(): Produce individual gene t-test plot of the two-tailed p-value
-
DigitalCellSorter.makeIndividualGeneTtestPlot(gene, analyzeBy='label', **kwargs)[source] Produce individual gene t-test plot of the two-tailed p-value.
- Parameters:
- gene: str
Name of gene of interest
- analyzeBy: str, Default ‘label’
What level of lablels to include. Other possible options are ‘label’ and ‘celltype’
Any parameters that function ‘makeTtestPlot’ can accept
- Returns:
None
- Usage:
DCS = DigitalCellSorter.DigitalCellSorter()
DCS.makeIndividualGeneTtestPlot(‘SDC1’)
Example output:
.png?raw=true)
Function makeIndividualGeneExpressionPlot(): Produce individual gene expression plot on a 2D layout
-
DigitalCellSorter.makeIndividualGeneExpressionPlot(genes, **kwargs)[source] Produce individual gene expression plot on a 2D layout
- Parameters:
- gene: str, or list-like
Name of gene of interest. E.g. ‘CD4, CD33’, ‘PECAM1’, [‘CD4’, ‘CD33’]
- hideClusterLabels: boolean, Default False
Whether to hide the clusters labels
- outlineClusters: boolean, Default True
Whether to outline the clusters with circles
Any parameters that function ‘internalMakeMarkerSubplots’ can accept
- Returns:
None
- Usage:
DCS = DigitalCellSorter.DigitalCellSorter()
DCS.makeIndividualGeneExpressionPlot(‘CD4’)
Example output:
Function makeHistogramNullDistributionPlot(): Produce histogram plot of the voting null distributions
-
DigitalCellSorter.makeHistogramNullDistributionPlot(*args, **kwargs) Produce histogram plot of the voting null distributions
- Parameters:
- dpi: int, Default 600
Resolution of the figure image
- extension: str, Default ‘png’
Format of the figure file
- Returns:
None
- Usage:
DCS = DigitalCellSorter.DigitalCellSorter()
DCS.makeHistogramNullDistributionPlot()
Example output:

Function makeAnnotationResultsMatrixPlot(): Produce voting results voting matrix plot
-
DigitalCellSorter.makeAnnotationResultsMatrixPlot(*args, **kwargs) Produce voting results voting matrix plot
- Parameters:
- dpi: int, Default 600
Resolution of the figure image
- extension: str, Default ‘png’
Format of the figure file
- Returns:
None
- Usage:
DCS = DigitalCellSorter.DigitalCellSorter()
DCS.makeAnnotationResultsMatrixPlot()
Example output:

Function makeMarkerExpressionPlot(): Produce image on marker genes and their expression on all clusters
-
DigitalCellSorter.makeMarkerExpressionPlot(*args, **kwargs) Produce image on marker genes and their expression on all clusters. Uses files generated by function DCS.Vote
- Parameters:
- dpi: int, Default 600
Resolution of the figure image
- extension: str, Default ‘png’
Format of the figure file
- Returns:
None
- Usage:
DCS = DigitalCellSorter.DigitalCellSorter()
DCS.makeMarkerExpressionPlot()
Example output:

Function makeStackedBarplot(): Produce stacked barplot with cell fractions
-
DigitalCellSorter.makeStackedBarplot(*args, **kwargs) Produce stacked barplot with cell fractions
- Parameters:
- clusterName: str, Deafult None
Label to include at the bar bottom. If None the self.dataName value will be used
- legendStyle: boolean, Default False
Use one out of two styles of this figure
- includeLowQC: boolean, Default True
Wether to include low quality cells
- dpi: int, Default 600
Resolution of the figure image
- extension: str, Default ‘png’
Format of the figure file
- Returns:
None
- Usage:
DCS = DigitalCellSorter.DigitalCellSorter()
DCS.makeStackedBarplot(clusterName)
Example output:

Function makeSankeyDiagram(): Make a Sankey diagram, also known as ‘river plot’ with two groups of nodes
-
DigitalCellSorter.makeSankeyDiagram(*args, **kwargs) Make a Sankey diagram, also known as ‘river plot’ with two groups of nodes
- Parameters:
- df: pandas.DataFrame
With counts (overlaps)
- colormapForIndex: dictionary, Default None
Colors to use for nodes specified in the DataFrame index
- colormapForColumns: dictionary, Default None
Colors to use for nodes specified in the DataFrame columns
- linksColor: str, Default ‘rgba(100,100,100,0.6)’
Color of the non-overlapping links
- title: str, Default ‘’
Title to print on the diagram
- interactive: boolean , Default False
Whether to launch interactive JavaScript-based graph
- quality: int, Default 4
Proportional to the resolution of the figure to save
- nodeLabelsFontSize: int, Default 15
Font size for node labels
- nameAppend: str, Default ‘_Sankey_diagram’
Name to append to the figure file
- Returns:
None
- Usage:
DCS = DigitalCellSorter.DigitalCellSorter()
DCS.makeSankeyDiagram(df)
Example output:
